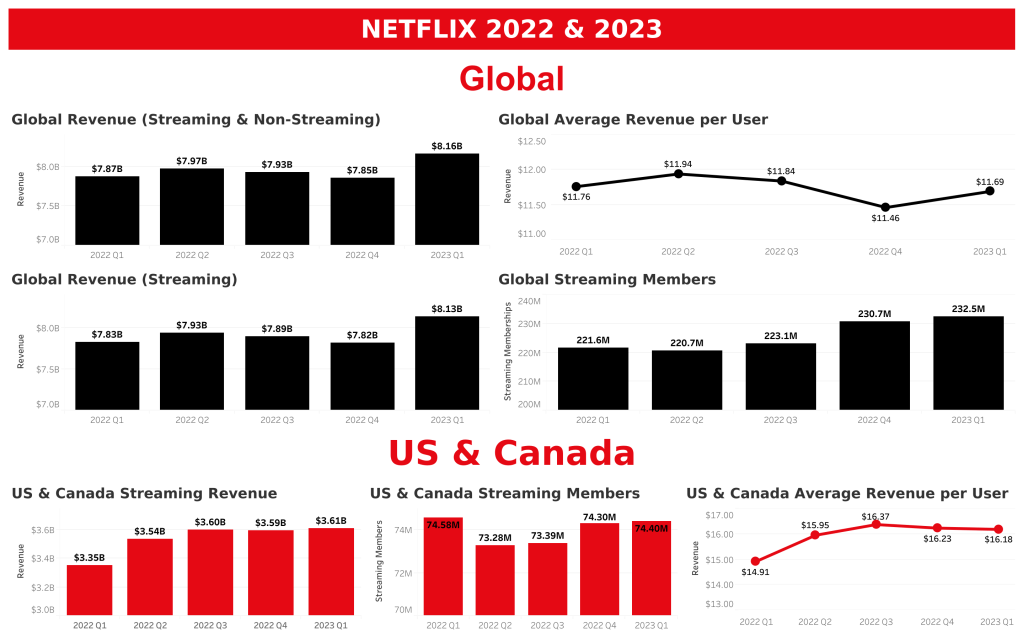
This is a typical type of revenue dashboard that you would see for a business like Netflix. I want to make a note that even though this has a limited time period, in an ideal world this could be a live dashboard with filters for certain fields that can allow end users to search for exactly what they’re looking for without having to ask for a separate report being pulled.
How this is currently built would be for a specific request like if the Director of Product Strategy asked to see revenue numbers and membership numbers for 2022 and Q1 of 2023. Maybe they want to see how a strategy choice that started being implemented in the beginning of 2022 and see how that differed from 2021. This is something that can be a great reference when discussing the effect that a pricing change has on the consumers of Netflix.
The full dashboard can be found here. A playbook for the dashboard can be seen here.

Leave a comment